 Post-Click Funnel Playbook
The 10 CRO Questions Every Scaling Brand Asks Us
Straight answers from optimizing hundreds of stores. No fluff. Just what works.

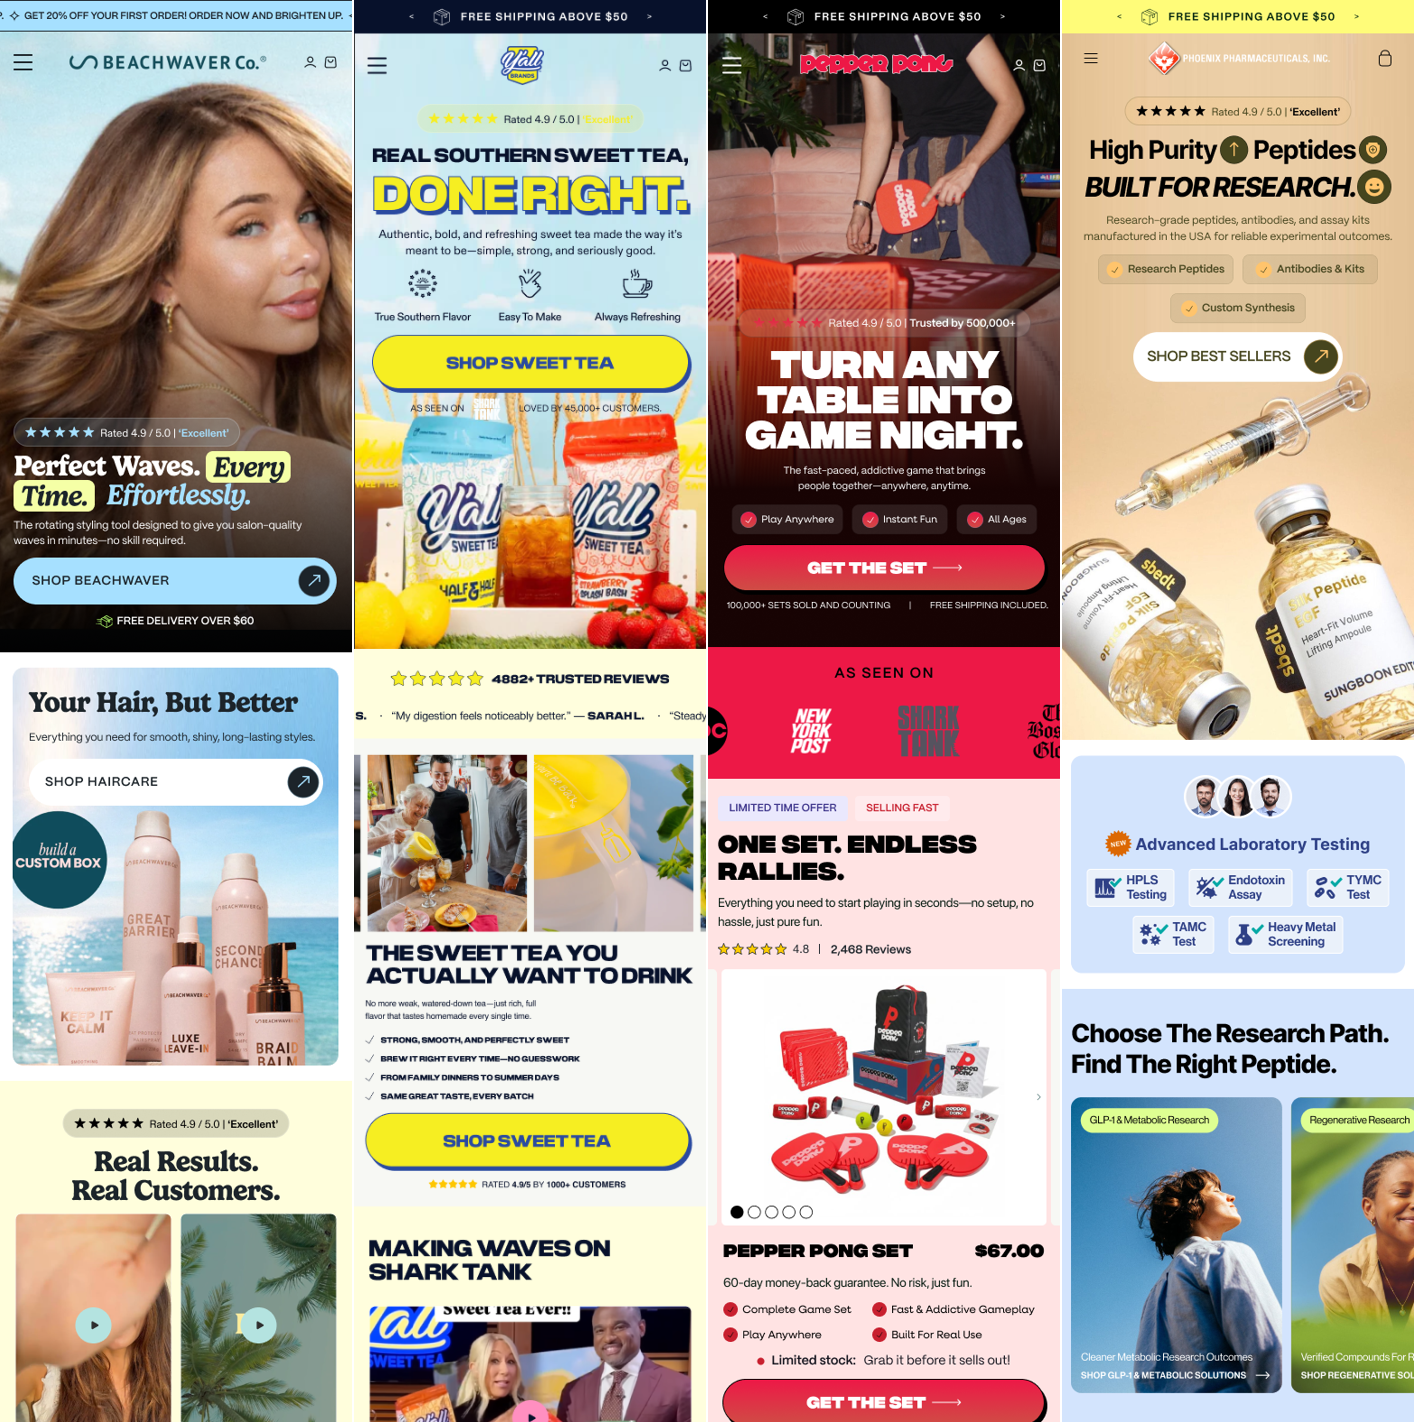
How should our landing page strategy differ across traffic temperatures?
Same page for all three = wrong message, wrong moment, wasted spend. Every traffic temperature is a different buyer at a different stage of trust. Match the page to the moment.

| Temperature | Who They Are | Page Type | Lead With |
|---|---|---|---|
| ❄ Cold | Never heard of you | Advertorial, VSL, Quiz | The problem. Educate before you sell. |
| ◑ Warm | Engaged but haven't bought | Long-form sales page | Proof and the offer |
| 🔥 Hot | Retargeting, cart abandoners | Short-form offer or direct checkout | Urgency. Remove all friction. |
- Identify which campaigns are driving cold vs. warm vs. hot traffic
- Build a dedicated page for each temperature, not one page for all three
- Make sure the ad creative and landing page feel like one continuous message
Test whole pages or individual elements?
Both, but at different stages. Testing elements on a broken concept is wasted effort. Know which mode you're in before you start.

Step 1. Check your CAC against breakeven
CAC over 2x breakeven
Your concept is broken. Test full page variants, different angles, offers, and structures. No element test will save a wrong concept.
CAC within 20% of breakeven
The concept works. Now squeeze more out of it. Test individual elements one at a time.
Step 2. When testing elements, work in this order:
- Headline
- Hero image or video
- CTA copy and placement
- Social proof format and position
- Offer framing and guarantee
Step 3. Call winners correctly
- Minimum 95% statistical confidence
- Minimum 100 conversions per variant before declaring a winner
- One variable at a time, always
What's the difference between a product page and a presell page?
Product page
Transactional. Features, price, add to cart. Built for people who already know what they want.
Presell page
Builds belief and handles objections before they see the offer. The warm-up act.
Which presell format should you use?
- Pull your cold traffic CVR right now
- If it's under 1.5%, you almost certainly need a presell step before your product page
- Pick the format that matches how much education your product needs
- Run the presell as a split test against your current direct-to-page setup
What are the 5 buyer beliefs you need to break?
Every unconverted visitor is stuck on at least one of these. High-converting pages address all five, in order.

- Print out your current landing page
- Read it as a skeptical first-time visitor
- Mark which of the 5 beliefs your page doesn't address
- Add the missing proof or objection-handling copy before your next test
Creative is dialled in but CVR hasn't moved, where's the ceiling?
The ceiling is rarely the page itself. When creative is strong but CVR won't move, the bottleneck has shifted downstream. Run through this checklist in order, don't skip ahead.
- Offer framing. Same offer, reframed differently can shift CVR 20–40%. Are you selling the outcome clearly enough?
- Traffic quality. Are you scaling into audiences that were never going to convert? Pull CVR by audience segment and compare.
- Funnel structure. Cold traffic doesn't convert on a hard sell. Do you have a presell step?
- Friction audit. Pull up your page on mobile right now. Count every tap, scroll, and field between landing and purchase.
- Offer fatigue. Has your market seen this offer too many times? Test a new mechanism, bonus stack, or guarantee.
How do you build a CRO testing roadmap that scales without slowing the team?
Systematise the process. Prioritise by impact. Protect the team's bandwidth.
- Assign one owner. One person owns the testing roadmap, full stop.
- Build your testing backlog. Rank every test idea by impact vs. effort. Work highest-leverage first.
- Tier your funnels. Tier 1 = highest spend (always first). Tier 2 = secondary. Tier 3 = experimental.
- Set a testing rhythm. At least one test live per Tier 1 funnel at all times. Write a hypothesis before every test: "We believe changing X will improve Y because Z."
- Review every two weeks. The roadmap is a living document, not a set-and-forget list.
- Document everything. Win or lose, every result is a learning. Build a record your whole team can see.
How do you find where your funnel is leaking?
Most teams only look at top and bottom, spend in, purchases out. Everything in between is invisible. That's where the money is hiding.
Step 1. Map every micro-step and measure each one
Track the conversion rate at every single step. Any drop below benchmark = that's your fix.
Step 2. Diagnose the drop-off
| Symptom | Likely Problem | Fix |
|---|---|---|
| Bounce rate over 70% | Message doesn't match the ad | Recheck headline vs. ad copy |
| CTA click rate under 10% | Page isn't building enough desire | Rework hook and offer clarity |
| Checkout abandonment over 65% | Friction or price shock | Simplify steps, add guarantee, test payment plan |
| High time on page, low CVR | Interested but unconvinced | Add objection handling, strengthen proof |
| Time on page under 30s | Lost them immediately | Fix the headline and opening hook |
Numbers show you where. Heatmaps and session recordings show you why. Use both before making any changes. Tools: Hotjar, Microsoft Clarity.
How do you balance CRO structure vs. brand aesthetic?
CRO without brand
Converts cheap customers who don't stick. Low LTV. High churn. Doesn't build a brand.
Brand without CRO
Beautiful pages that bleed spend. Looks great. Doesn't convert. Money goes in, customers don't come out.
The rules:
- Clarity always beats cleverness, a beautiful headline that confuses people loses every time
- Hierarchy, contrast, and whitespace are both brand and CRO tools, use them deliberately
- Social proof can be designed beautifully, it doesn't need to look like a generic review widget
- CTAs should be on-brand in tone but unmissable in placement and contrast
- Build the page conversion-first, get the structure and copy right first
- Apply brand on top, typography, colour, imagery, tone
- Never protect a brand guideline at the cost of a conversion principle
- When in doubt, ask: does this element help the visitor take action, or does it just look good?
Multiple products, multiple offers, how do you decide where the spend goes?
Don't follow ROAS. It's a misleading metric on its own. The funnel with the highest ROAS isn't always the one attracting customers who stay.
Step 1. Rank your funnels by what actually matters
- Calculate CVR × AOV × LTV for each funnel
- Calculate true contribution margin, after ad spend, COGS, and fulfilment
- The funnel with the best margin and highest LTV customers wins, even if CAC looks higher today
Step 2. Allocate spend by funnel maturity
Hero offer (60–70%)
Most proven, best margin. This is your primary funnel. Feed it.
Test offer (max 20%)
Hard cap until CAC is validated against breakeven. Don't scale before it's proven.
Harvest offer, retargeting + loyalty (lean budget, highest margin)
These customers already know you. Low spend, high return. Don't over-invest here.
Creative fatigue, seasonality, and market shifts change which funnel deserves the most spend. What's working in Q1 may not be your best bet in Q3.
What are the primary CRO metrics to track?
Stop optimising for vanity metrics. These are the numbers that tell the truth, in order of importance.
| Metric | What It Tells You | Benchmark |
|---|---|---|
| RPV (Revenue Per Visitor) | True value of your traffic. CVR + AOV in one number. | $3–$8 DTC |
| CAC vs. Breakeven CAC | Is the funnel sustainable right now? | Know your number cold |
| Checkout Initiation Rate | Are visitors getting far enough to consider buying? | 40–60% of LP visitors |
| Checkout Completion Rate | Are they finishing once they start? | 50–70% of initiations |
| LTV:CAC Ratio | Is this funnel worth running long term? | 3:1 minimum |
| Intra-funnel Step Rates | Where exactly is the drop-off happening? | Benchmark against yourself |
- Pull all six metrics for your top funnel today
- Find the weakest number, that's your highest-leverage fix
- Work top of the hierarchy down: RPV first, then CVR, then step rates
- Never optimise AOV before you've fixed conversion rate, sequence matters
The One-Page Summary
Every question in this guide comes back to the same principle, the page is where the sale is made or lost. Most brands treat it as an afterthought. The brands that scale treat it as the most important variable in their paid media stack.
1. Match the page to the traffic temperature
2. Fix the concept before the elements
3. Build all 5 buyer beliefs into every page
4. Diagnose funnel leaks with intra-funnel step rates
5. Allocate spend by funnel maturity, not ROAS
6. Track RPV, not just ROAS, it's the only honest number
- Former Strategy Consultant at Deloitte (4 years)
- Built and scaled a 7-figure brand
- Scaled Solvexmedia from 2 employees to 20+ in 4 years
- Grew from 1 client to 400+ clients
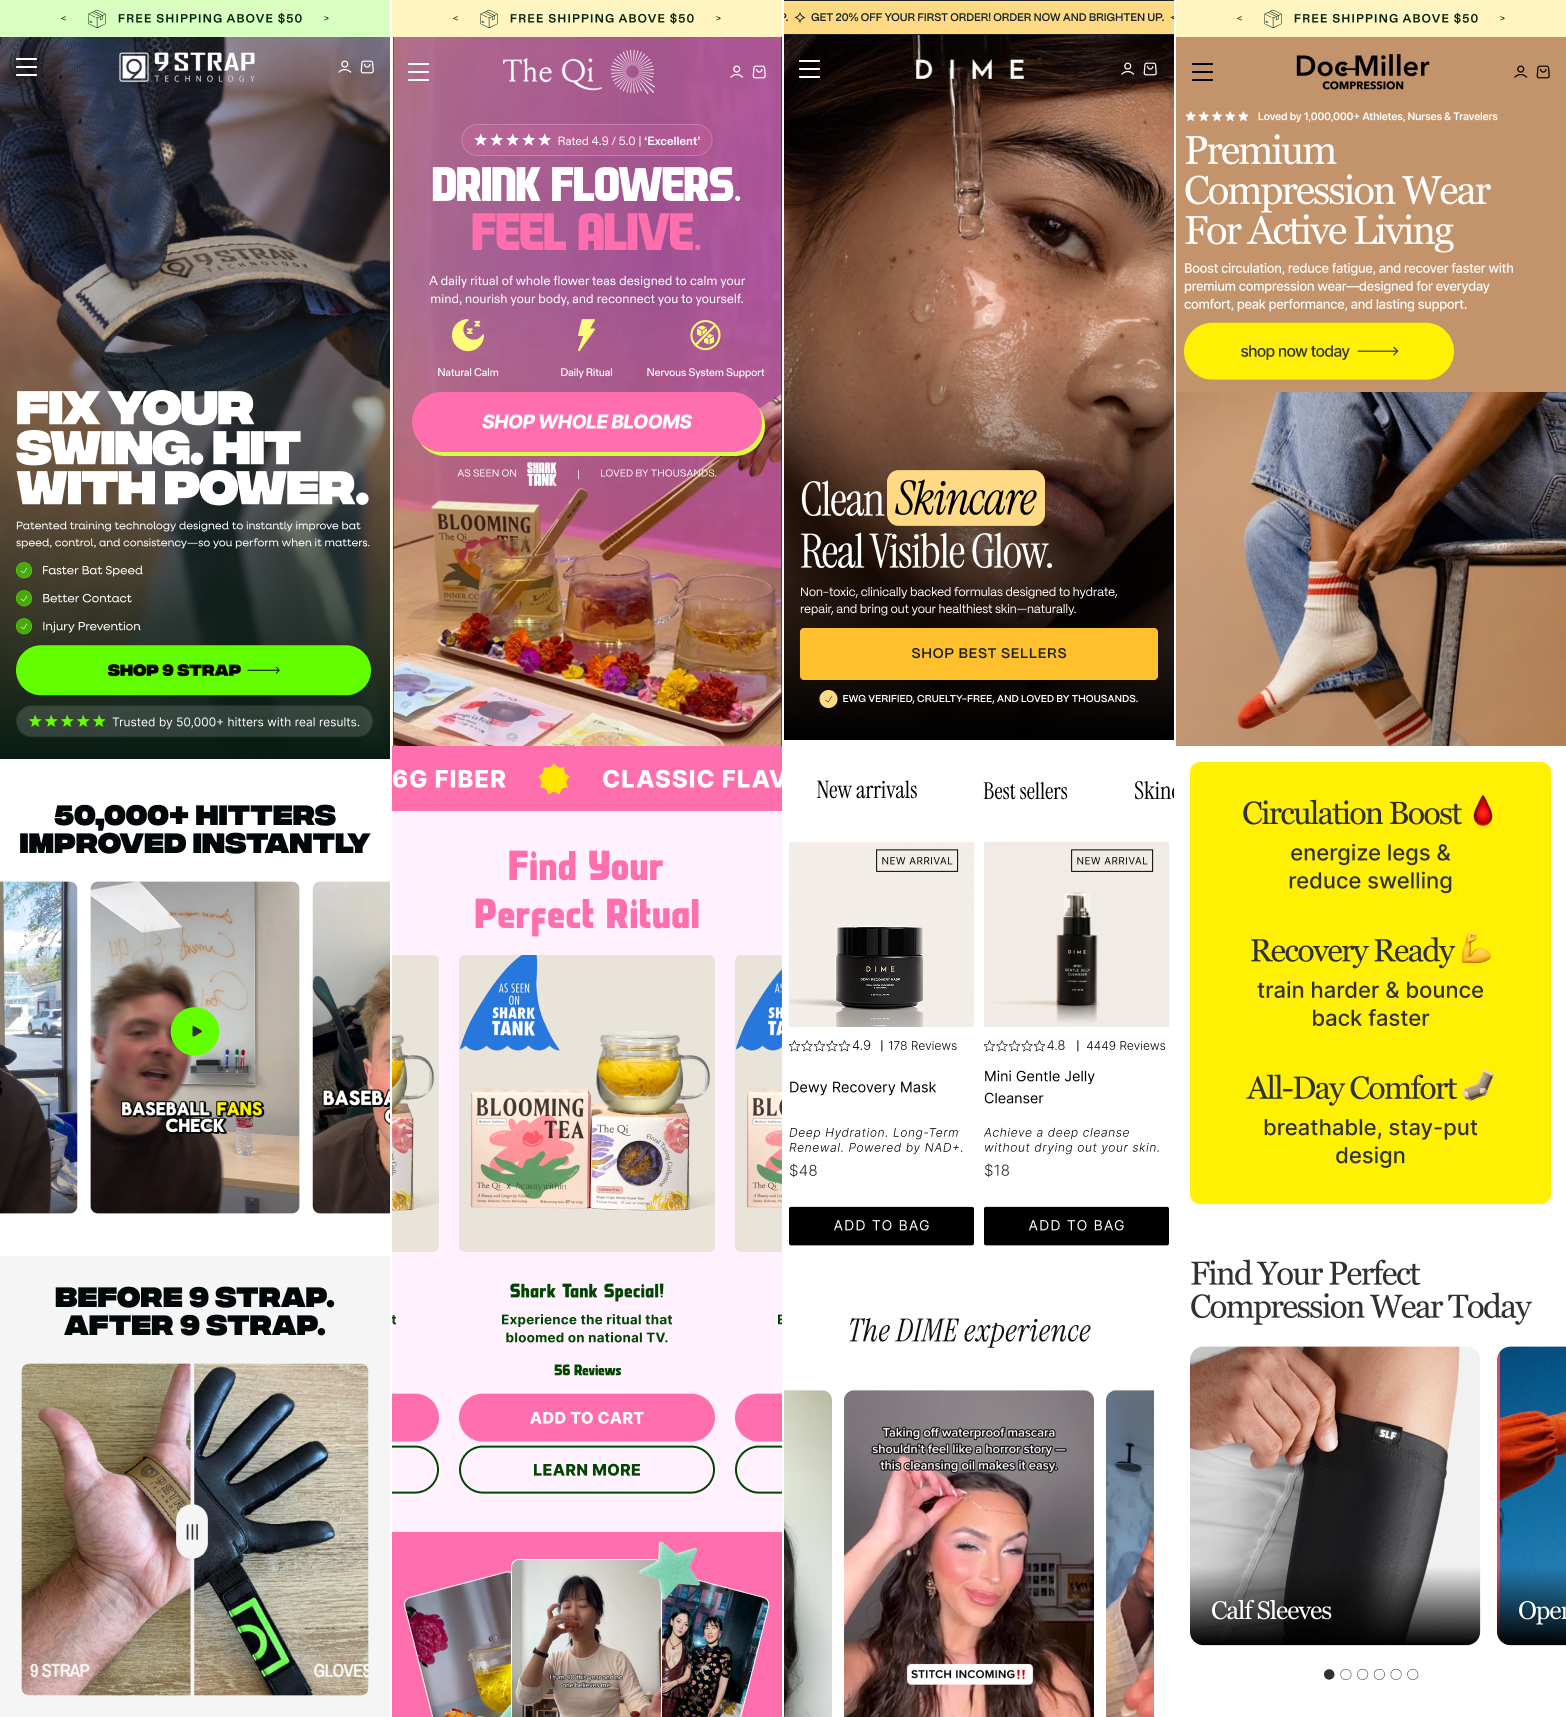
"Out of 22 A/B tests, 14 were significant wins, generating $1,338,625 in incremental annual revenue without increasing ad spend."


| Metric | Before (Control) | After CRO + A/B Testing |
|---|---|---|
| Monthly Ad Spend | $30,000 | $30,000 |
| Monthly Sessions | 22,500 | 22,500 |
| Conversion Rate | 1.21% | 2.48% (+105%) |
| Average Order Value | $74 | $78 |
| Revenue Per Visitor | $0.90 | $1.93 |
| Cost Per Acquisition | $102 | $49 (52% lower) |
| Monthly Revenue | $20,250 | $43,425 |
| Annualized Impact | — | +$277,000 |
To Your Store?
We optimize stores from $1M to $50M+ per year. On the call we go through your store live, show you exactly where you're losing sales, and tell you what we would fix first. If we can't help, we tell you that too.
- 400+ brands optimized
- +105% CVR on the same ad spend
- $1.3M+ added for one client