 Cart Optimization Masterguide
How To Get Your Slide-Out Cart To PRINT
Most brands ignore their cart. That's why it's the easiest 20% lift on your store.

Why Most Slide-Out Carts Leak Revenue
The Psychology of the Cart Moment
They've mentally committed. Every second from here either confirms or kills it.
What the visitor is feeling when they open the cart:
+$14.95
The 8 Non-Negotiable Cart Elements
image
Upsell and Cross-Sell Strategy Inside the Cart
Rule: the upsell must feel like a recommendation, not a pitch. Extraction closes the cart.
pairs perfectly · +$14.95
Just $2.00
+ $4.95
Covers damage + faults · $9.95
The Trust Layer
The cart is the highest-anxiety moment, most brands strip all trust right out of it.
Mobile Cart Optimization
70%+ of add-to-carts happen on mobile. A broken mobile cart = majority of revenue lost.
The Metrics That Tell You If Your Cart Is Working
| Metric | What it tells you | Benchmark |
|---|---|---|
| Cart-to-checkout rate | % of cart opens that start checkout | 40–60% |
| Checkout completion rate | % of checkouts started that complete | 50–70% |
| Cart abandonment rate | % who add to cart but don't buy | Below 65% |
| Upsell attach rate | % of carts that include an upsell item | 15–30% |
| AOV lift from cart | AOV with upsells vs. without | +20–40% |
| Time to checkout | Seconds from cart open to checkout start | Under 60s |
The weakest metric is your highest-leverage fix. Cart-to-checkout rate first. Upsell attach rate second. Never optimise AOV before fixing abandonment.
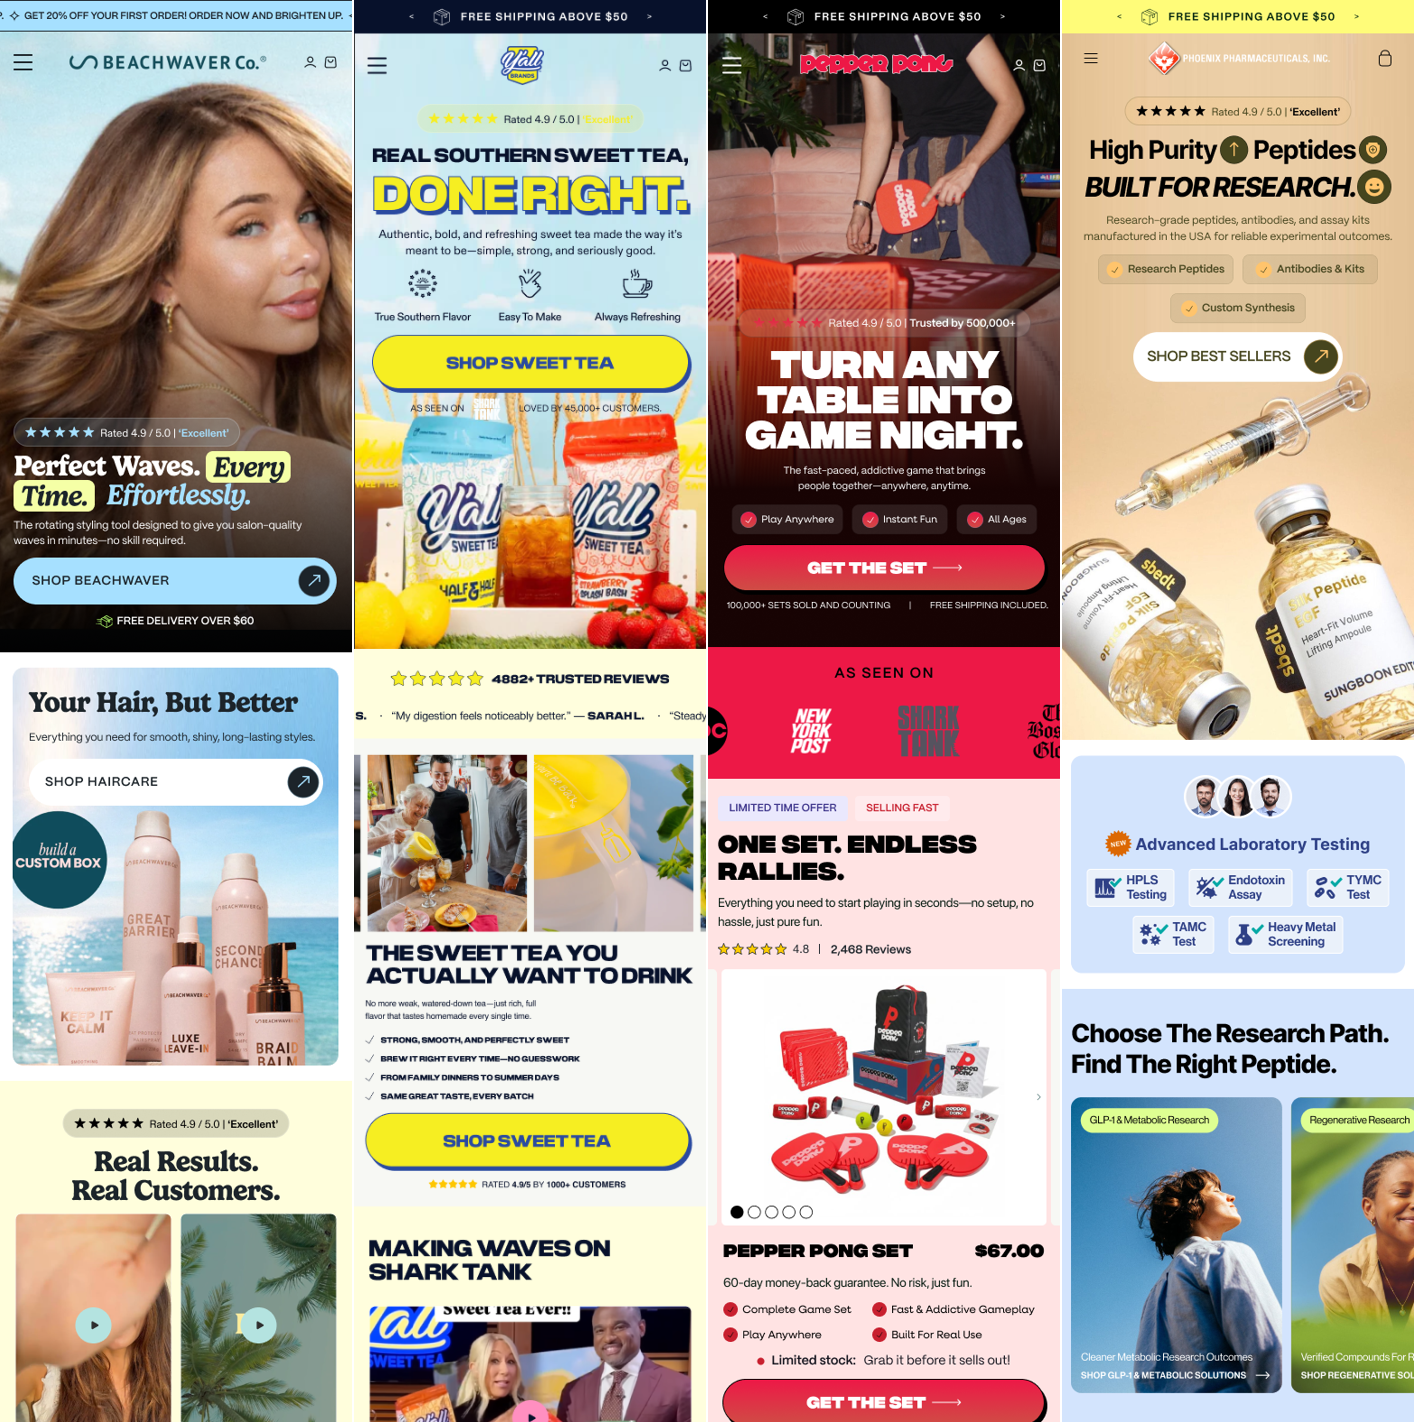
What High-Converting Carts Actually Look Like
Four real carts applying every principle in this guide, and what they're doing right.


The Summary
- Former Strategy Consultant at Deloitte (4 years)
- Built and scaled a 7-figure brand
- Scaled Solvexmedia from 2 employees to 20+ in 4 years
- Grew from 1 client to 400+ clients
"Out of 22 A/B tests, 14 were significant wins, generating $1,338,625 in incremental annual revenue without increasing ad spend."


| Metric | Before (Control) | After CRO + A/B Testing |
|---|---|---|
| Monthly Ad Spend | $30,000 | $30,000 |
| Monthly Sessions | 22,500 | 22,500 |
| Conversion Rate | 1.21% | 2.48% (+105%) |
| Average Order Value | $74 | $78 |
| Revenue Per Visitor | $0.90 | $1.93 |
| Cost Per Acquisition | $102 | $49 (52% lower) |
| Monthly Revenue | $20,250 | $43,425 |
| Annualized Impact | — | +$277,000 |

To Your Store?
We optimize stores from $1M to $50M+ per year. On the call we go through your store live, show you exactly where you're losing sales, and tell you what we would fix first. If we can't help, we tell you that too.
- 400+ brands optimized
- +105% CVR on the same ad spend
- $1.3M+ added for one client